Code
import pandas as pd
import matplotlib.pyplot as plt
from helpers import plot_release_year_distribution, create_keyword_wordcloud, create_genre_distribution

df = pd.read_csv("./data/TMDB-Small.csv")

#df

#df.head()import pandas as pd
import matplotlib.pyplot as plt
from helpers import plot_release_year_distribution, create_keyword_wordcloud, create_genre_distribution
df = pd.read_csv("./data/TMDB-Small.csv")
#df
#df.head()plot_release_year_distribution(df)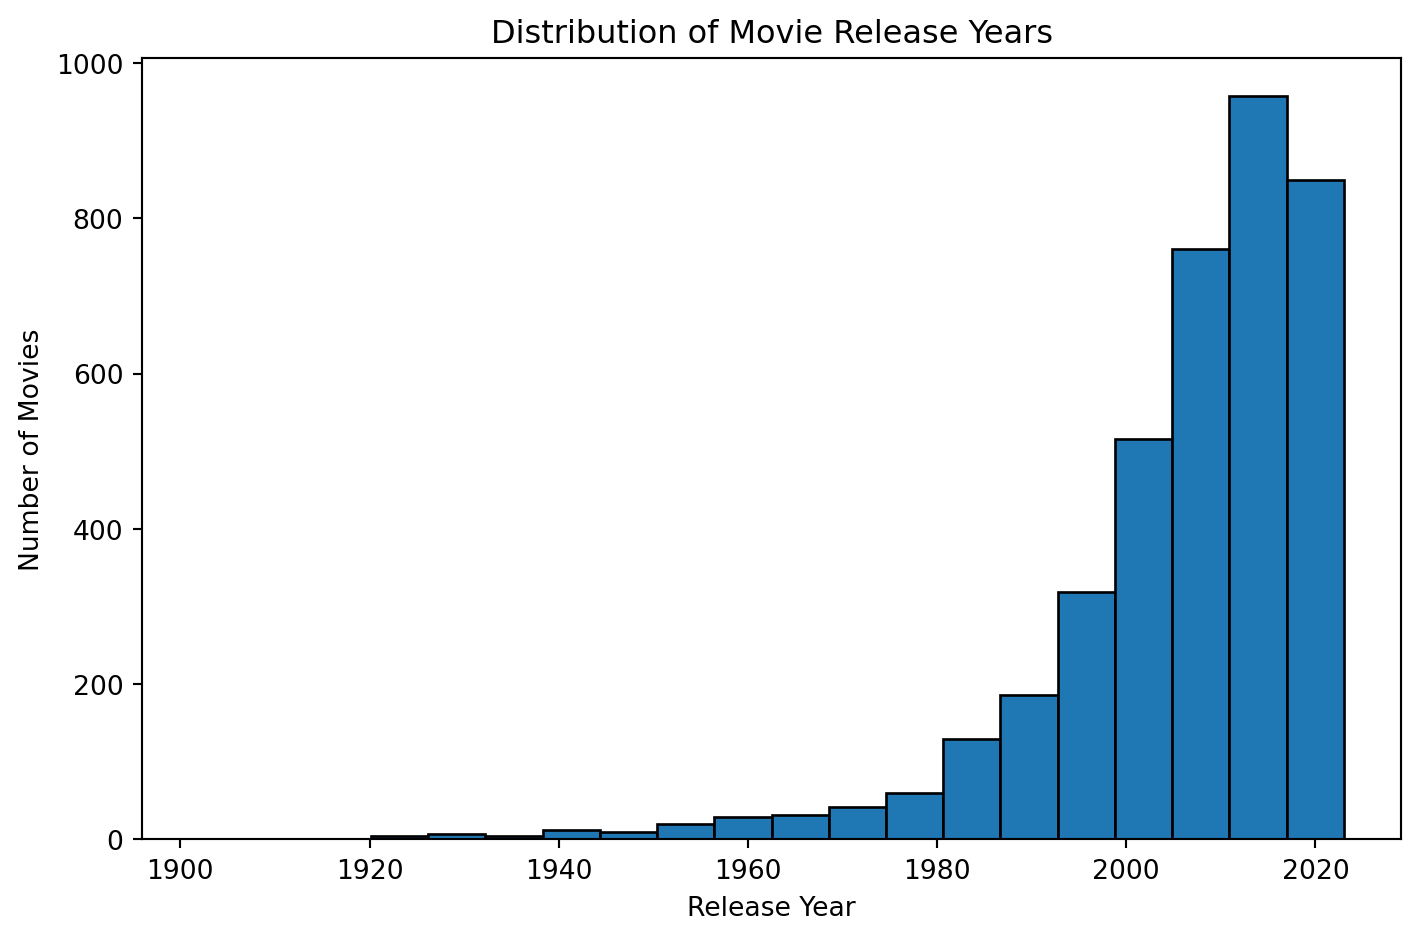
import plotly.express as px

df['primary_genre'] = df['genres'].str.split(',').str[0].str.strip()

fig = px.scatter(df, x='vote_count', y='vote_average', hover_data=['title'], color='primary_genre', title='Vote Count vs Vote Average')
fig.show()create_keyword_wordcloud(df)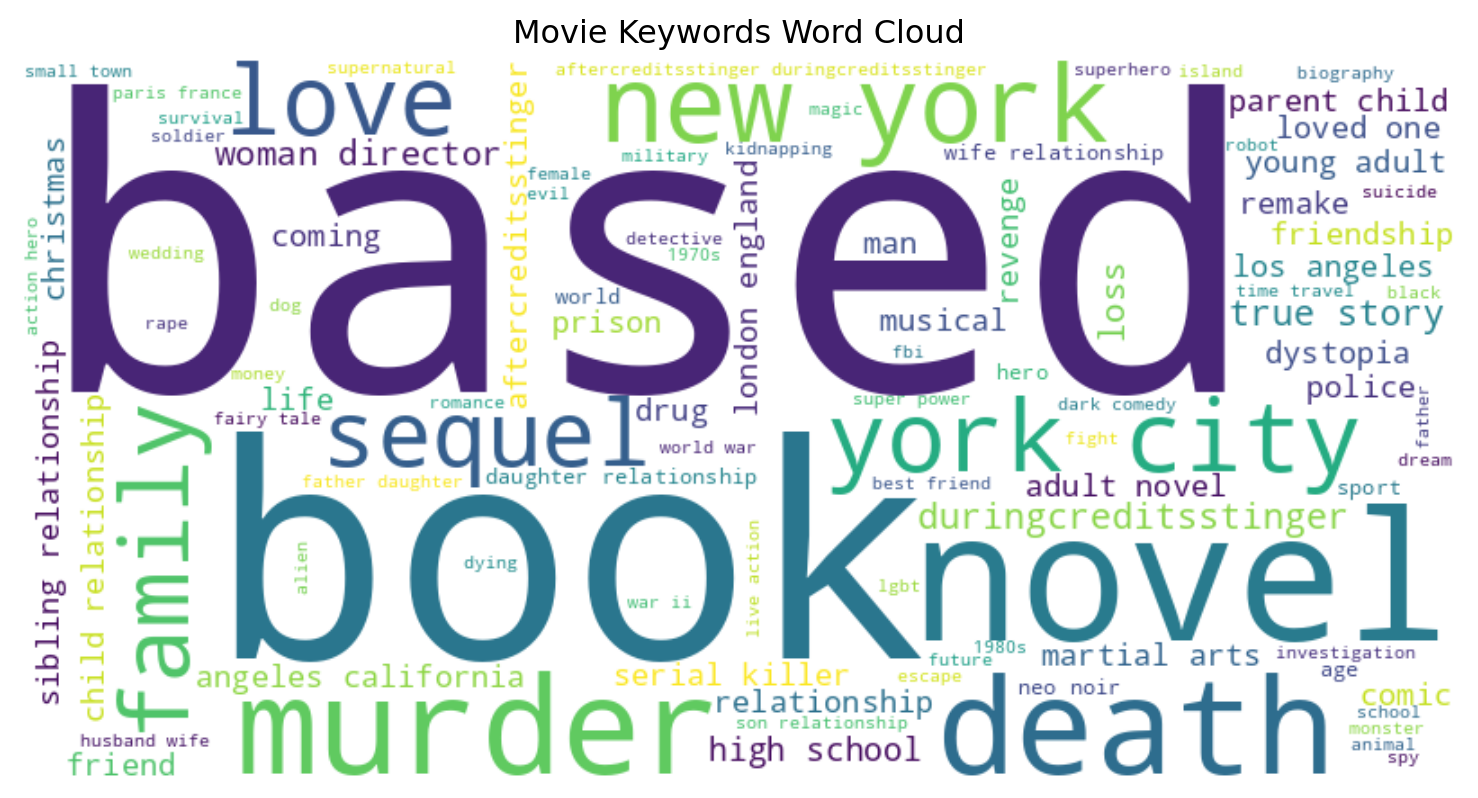
create_genre_distribution(df)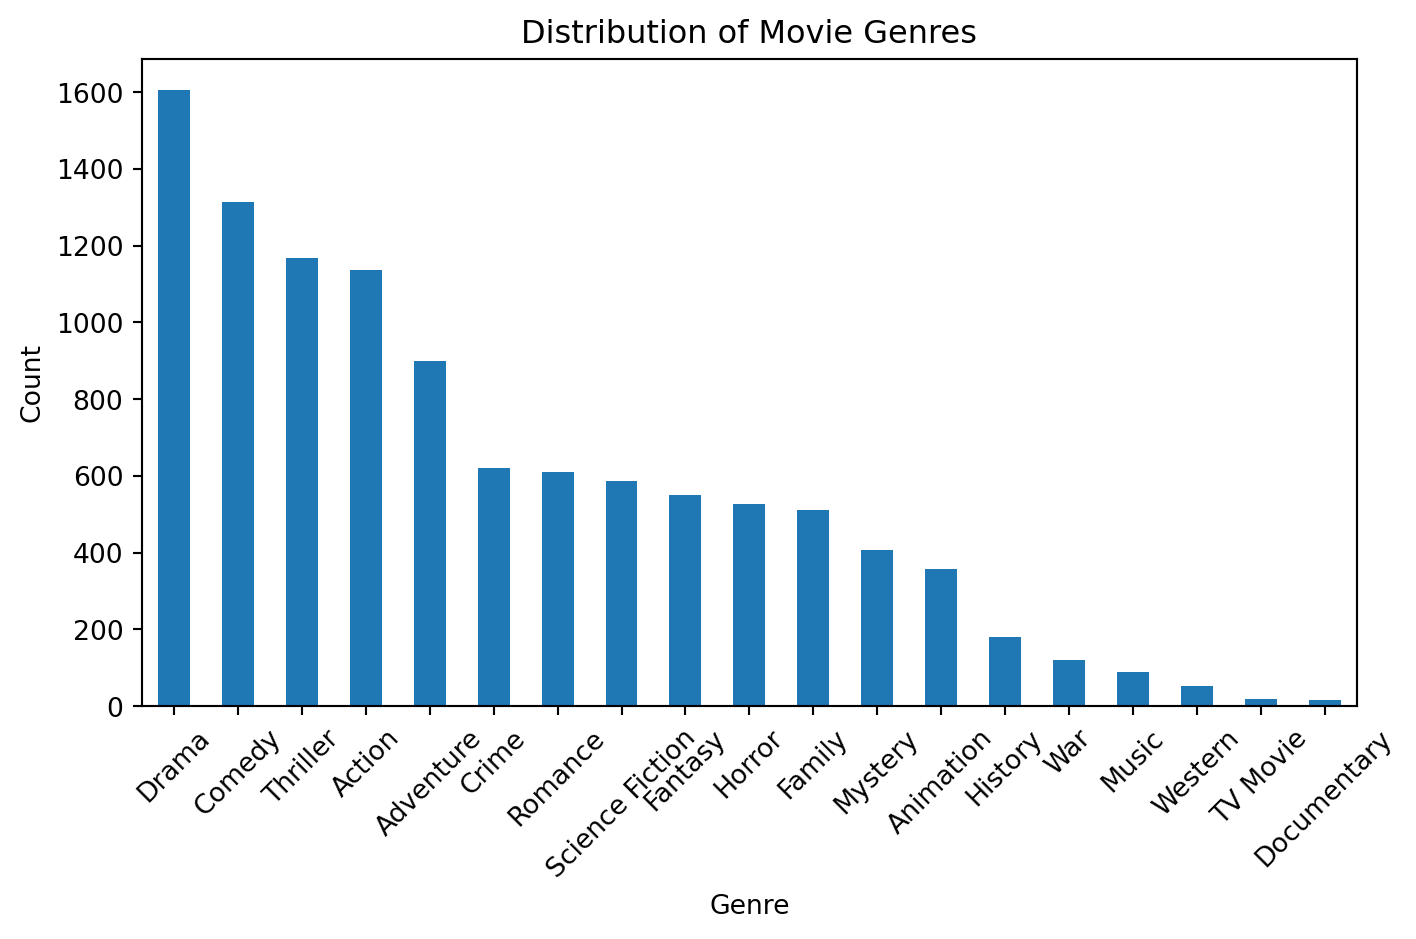
# Random Movie
movie = df.sample(1)

url = f"https://image.tmdb.org/t/p/w600_and_h900_bestv2{movie['poster_path'].values[0]}"Title: Spy Kids

Description: Carmen and Juni think their parents are boring. Little do they know that in their day, Gregorio and Ingrid Cortez were the top secret agents from their respective countries. They gave up that life to raise their children. Now, the disappearances of several of their old colleagues forces the Cortez\\’ return from retirement. What they didn\\’t count on was Carmen and Juni joining the “family business.”